Curve fitting

In curve fitting, a mathematical function is constructed that has the best fit to a set of data points, subject to constraints. This can be achieved through interpolation, which requires an exact fit to the data, or smoothing, which involves construction of a “smooth” function that approximates the data. There is a related topic called regression analysis, which addresses questions of statistical inference, such as how much uncertainty there is in a curve fit to data with random errors. Data fit curves can be used for data visualization, to infer values for functions when data are not available, and to summarize relationships between variables. The term extrapolation refers to using a fitted curve beyond the range of observed data and is subject to uncertainty, as it may reflect the method used to construct the curve just as much as it may reflect the observed data.

Curve fitting is the process of finding a mathematical function in an analytic form that best fits this set of data. This data further helps to detect and remove noise from functions, summarize the relationships, find a trend from the data, etc. 

Based on the nature of the data curve fitting can categorize them into two parts and they are as:

Best Fit In this case, we assume that the measured data points are noisy. Thus, we should avoid fitting a curve that intersects every point in the data. We are trying to find a function that minimizes some predefined error on the given data points. Linear regression is the simplest best fit method.

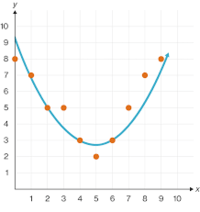
below is an diagramatic representation of Best Fit curve fitting.

Exact Fit  is assumed that the given samples are not noisy, and we wish to learn the curve passing through each point. It can be used to determine minimums, maxima, and zero crossings of functions, or to derive finite-difference approximations.

Below are some of the examples of Exact Curve, Quadratic, Cubic fit.

Best Fit